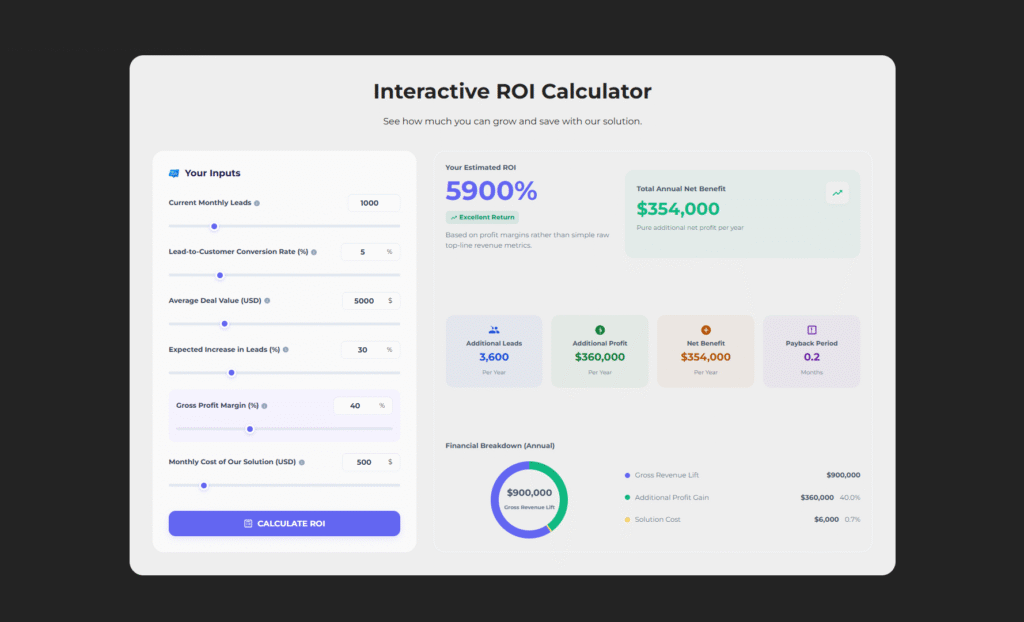
This Interactive ROI Calculator is a high-performance tool engineered to project the financial impact of sales and marketing initiatives with precision.
By adjusting key business metrics through an intuitive, real-time interface, users can instantly visualize how strategic changes influence their growth
potential and bottom-line results. The dynamic dashboard provides immediate feedback on essential KPIs, including annual net benefit, total profit gains,
and investment payback periods. To enhance clarity, a built-in, animated breakdown chart offers a sophisticated visual comparison of revenue growth, profit,
and operational costs. The system also features an intelligent, automated badge system that categorizes projected returns, allowing users to grasp
business implications at a single glance. Beyond simple calculations, this tool acts as a strategic assistant, transforming complex financial data into actionable,
easy-to-understand insights. Its robust, responsive design ensures a seamless experience across all devices, making it perfect for both internal planning and
client-facing presentations. Ultimately, it empowers teams to justify investments and demonstrate value with unparalleled professional impact.
First Layout
In this layout, a custom content block with image, heading, and CTA appears on the left,
while dynamic image are displayed on the right.
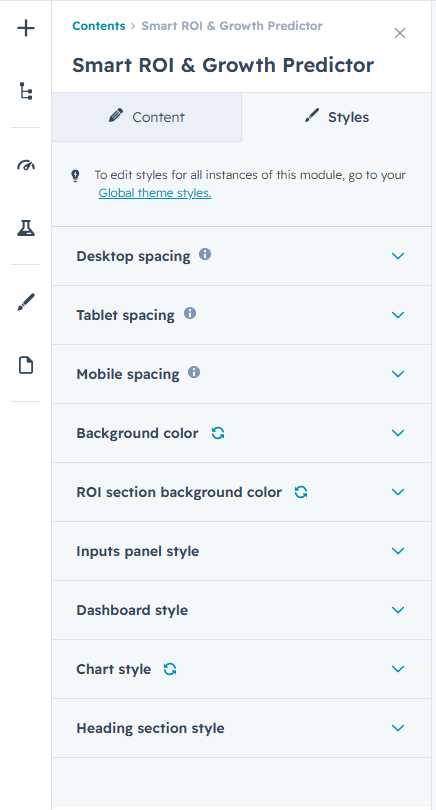
Easily customize the overall calculator appearance to create a professional, high-conversion tool that fits your website’s aesthetic perfectly. Control container backgrounds, opacity, and responsive spacing to ensure a
clean, balanced, and premium layout across all devices.
Style the input panel with custom typography and field settings, ensuring that sliders, buttons, and data-entry boxes provide clear, intuitive visual feedback. Personalize the dashboard metrics and financial summary
cards by adjusting colors and icon styles to maintain strong readability and perfect alignment with your brand.
Enhance data clarity by designing the financial breakdown charts and table rows with custom color themes, making complex calculations easy to understand at a glance. Refine the ROI status badges and calculation triggers
with specific hover states and transitions to ensure a smooth, engaging, and professional user experience.